Debug a flow with breakpoints using Flow Debugger
STANDARD PREMIUM ULTIMATE
This documentation gives you an overview, how to set and use breakpoints in your flow. Breakpoints can be set on the input and output of a node. This helps you to inspect outgoing and incoming messages of a node, step forward individual messages and drop messages.
Enable debugger
The Flow Debugger is preinstalled in the qibb environment, You can find it in the sidebar tab in the editor. Select the Debugger window by left click on the icon in the sidebar menu. By default the Flow Debugger is disabled, click on the button to enable it.
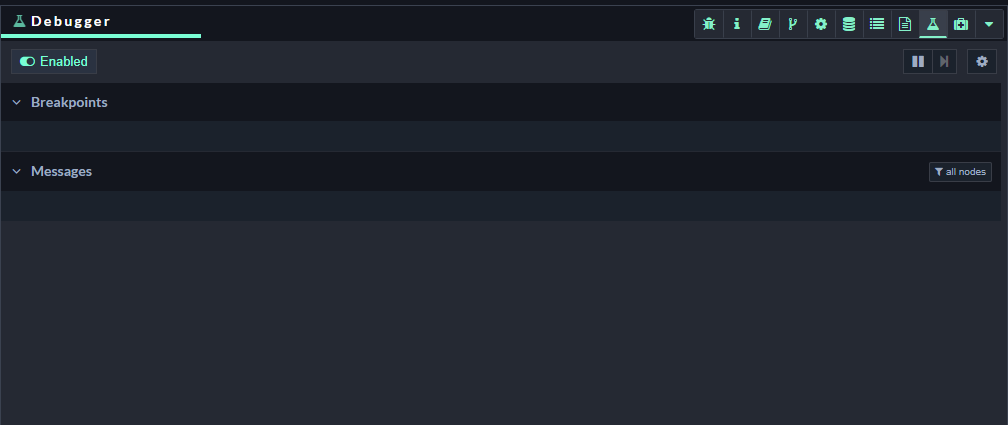
Flow Debugger window in the editor
In the debugger options ⚙️ you can change the debug mode. By default it is set to pause all nodes, which will lead to stop the complete flow, when a breakpoint is reached. This may causes unintentional behavior while debugging. To avoid this set the mode to pause at breakpoint. In this mode, only the node with a breakpoint will be paused. Other nodes are not affected by this.
Manage breakpoints
If you hover over a node's port, when the debugger is enabled, an indicator will appear.
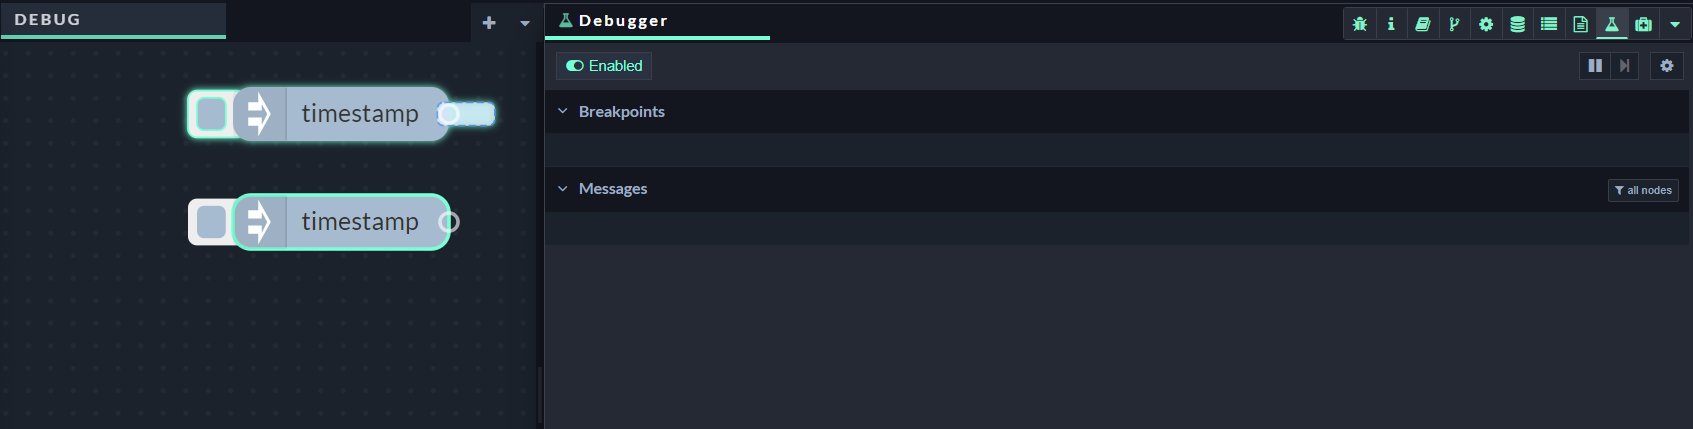
Hover over node port to add breakpoint
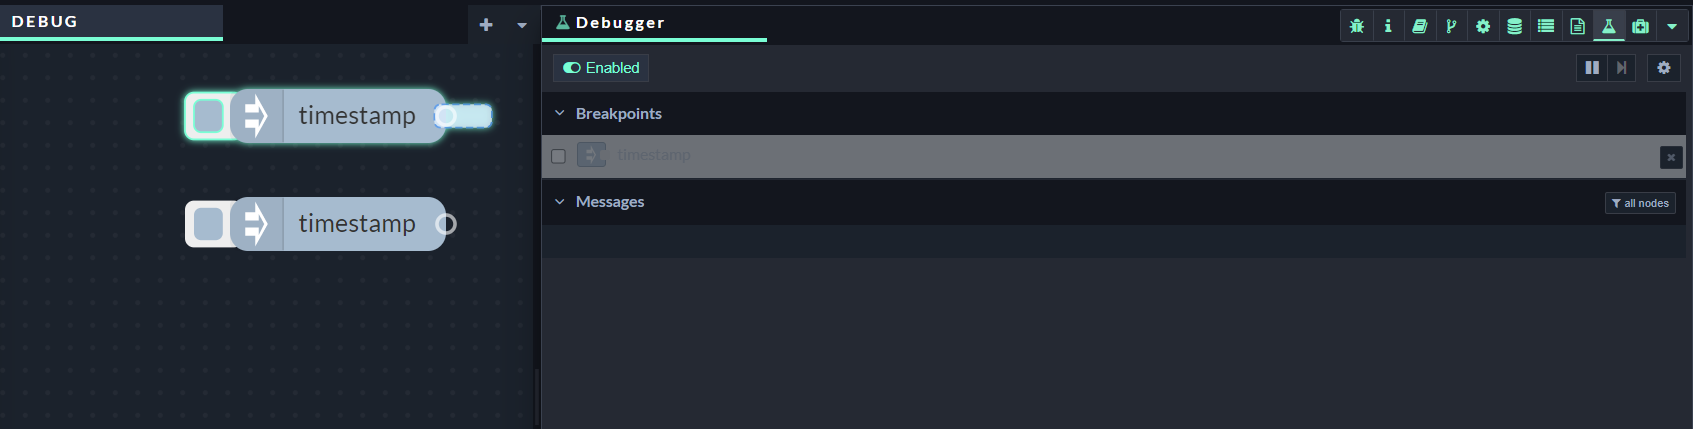
Click once on the indicator to set a breakpoint. It will turn solid blue and an entry will appear on the sidebar. This entry shows the node of the breakpoint and whether its on the input or output.
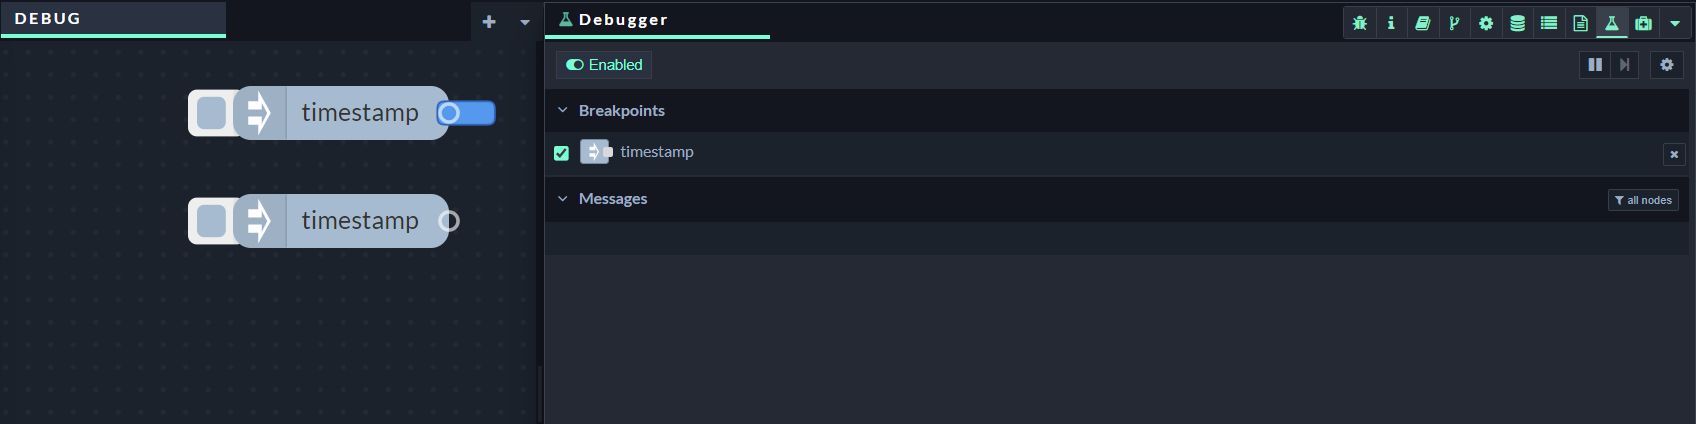
One Click: Breakpoint is activated (blue)
If you click on it again, the breakpoint will turn light blue and be deactivated but remain in place.
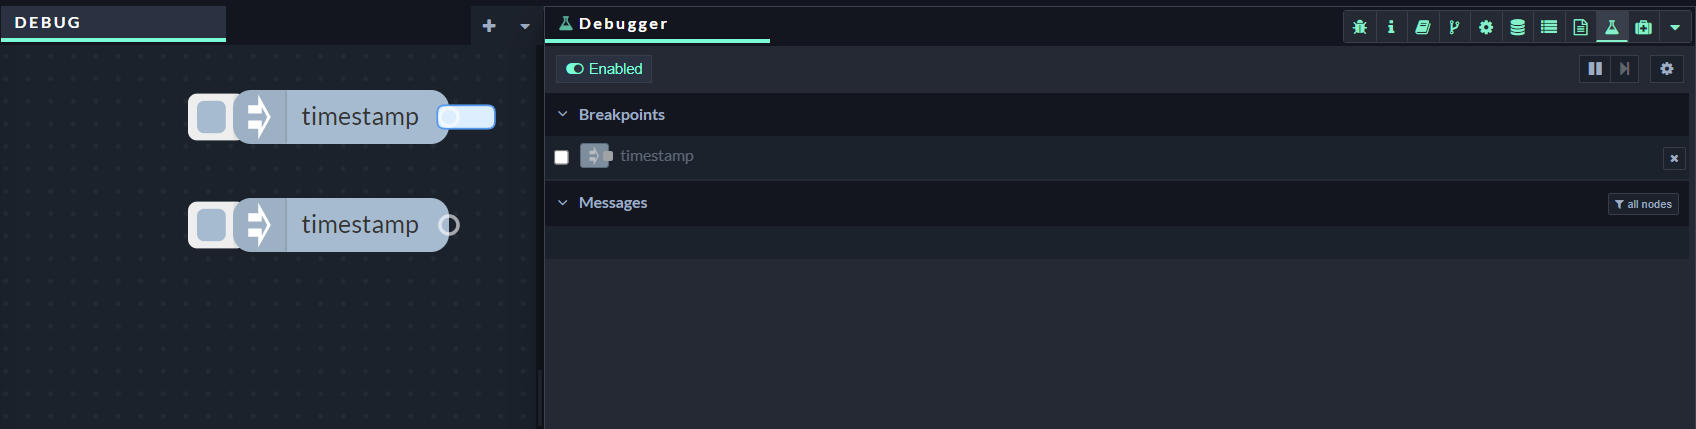
Two clicks: Breakpoint is deactivated (light blue)
Clicking on it again will remove the breakpoint entirely (dotted outline).
Three clicks: Remove the breakpoint
You can deactivate a breakpoint using its checkbox in the sidebar, and remove it by clicking the x button. If you hover over the breakpoint on the node or the list entry, the associated components will be highlighted.
Work with breakpoints
An active breakpoint pauses the runtime, whenever a message arrives at it. Once paused, the flow will show how many messages are queued up at each node input and output. Those messages will also be listed in the sidebar, ordered how the runtime will process them.
You can pause and continue the runtime manually using the pause ⏸️ /play ▶️ button in the sidebar.

The breakpoint shows the message at the inject output
If you click the step button at the top of the sidebar, the runtime will process the first message in the list. You can step individual messages by clicking the step button that appears when you hover over the message. You can also delete any message from the queue by clicking its delete button. This will prevent the message from passing any further in the flow.
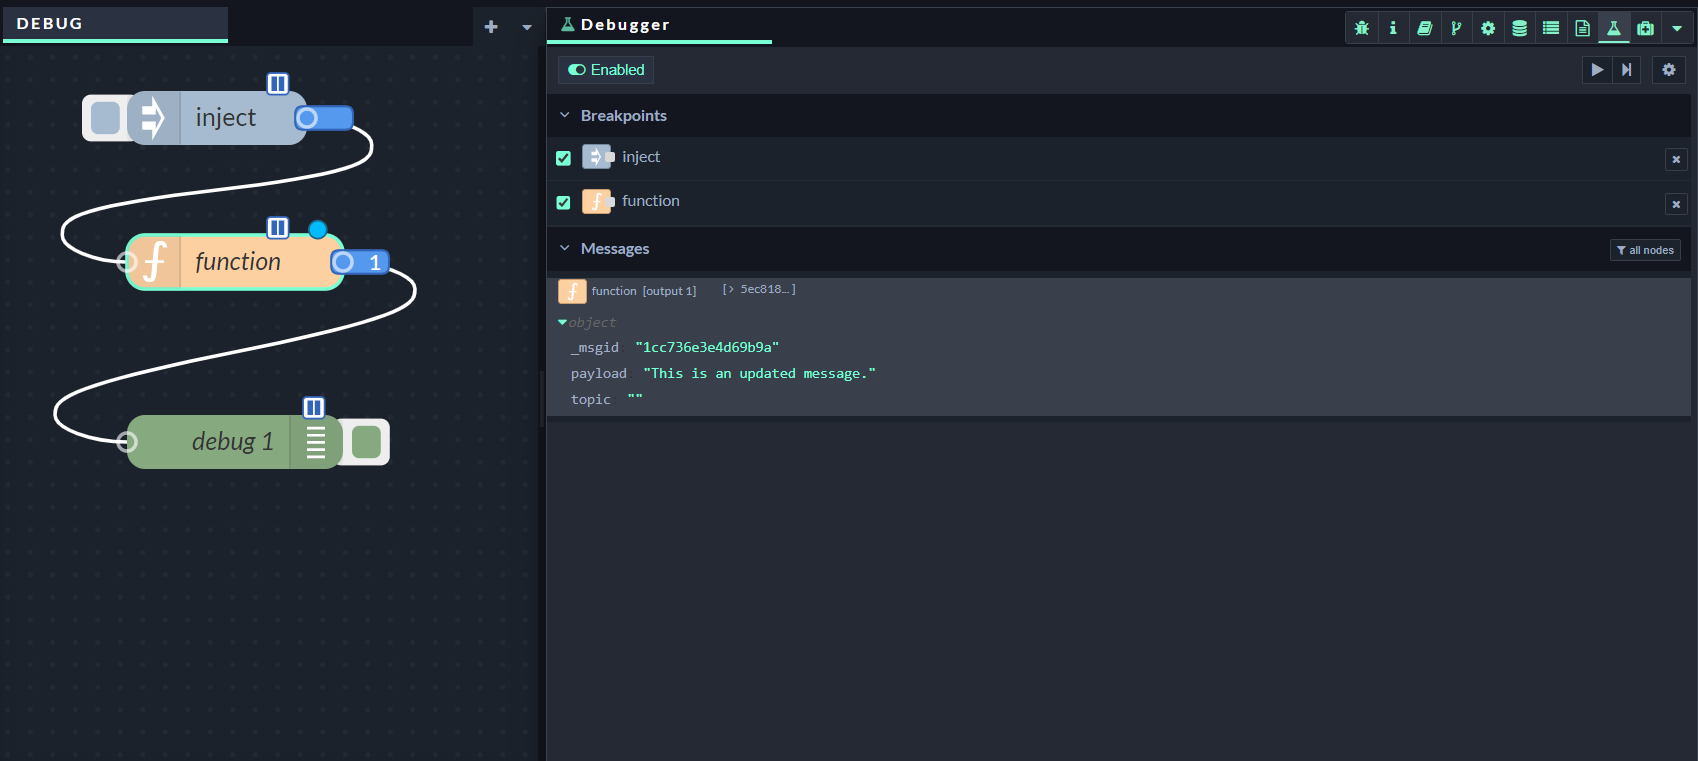
The breakpoint shows the message at the function output
Due to the way Subflows work, breakpoints on Subflow outputs will be ignored