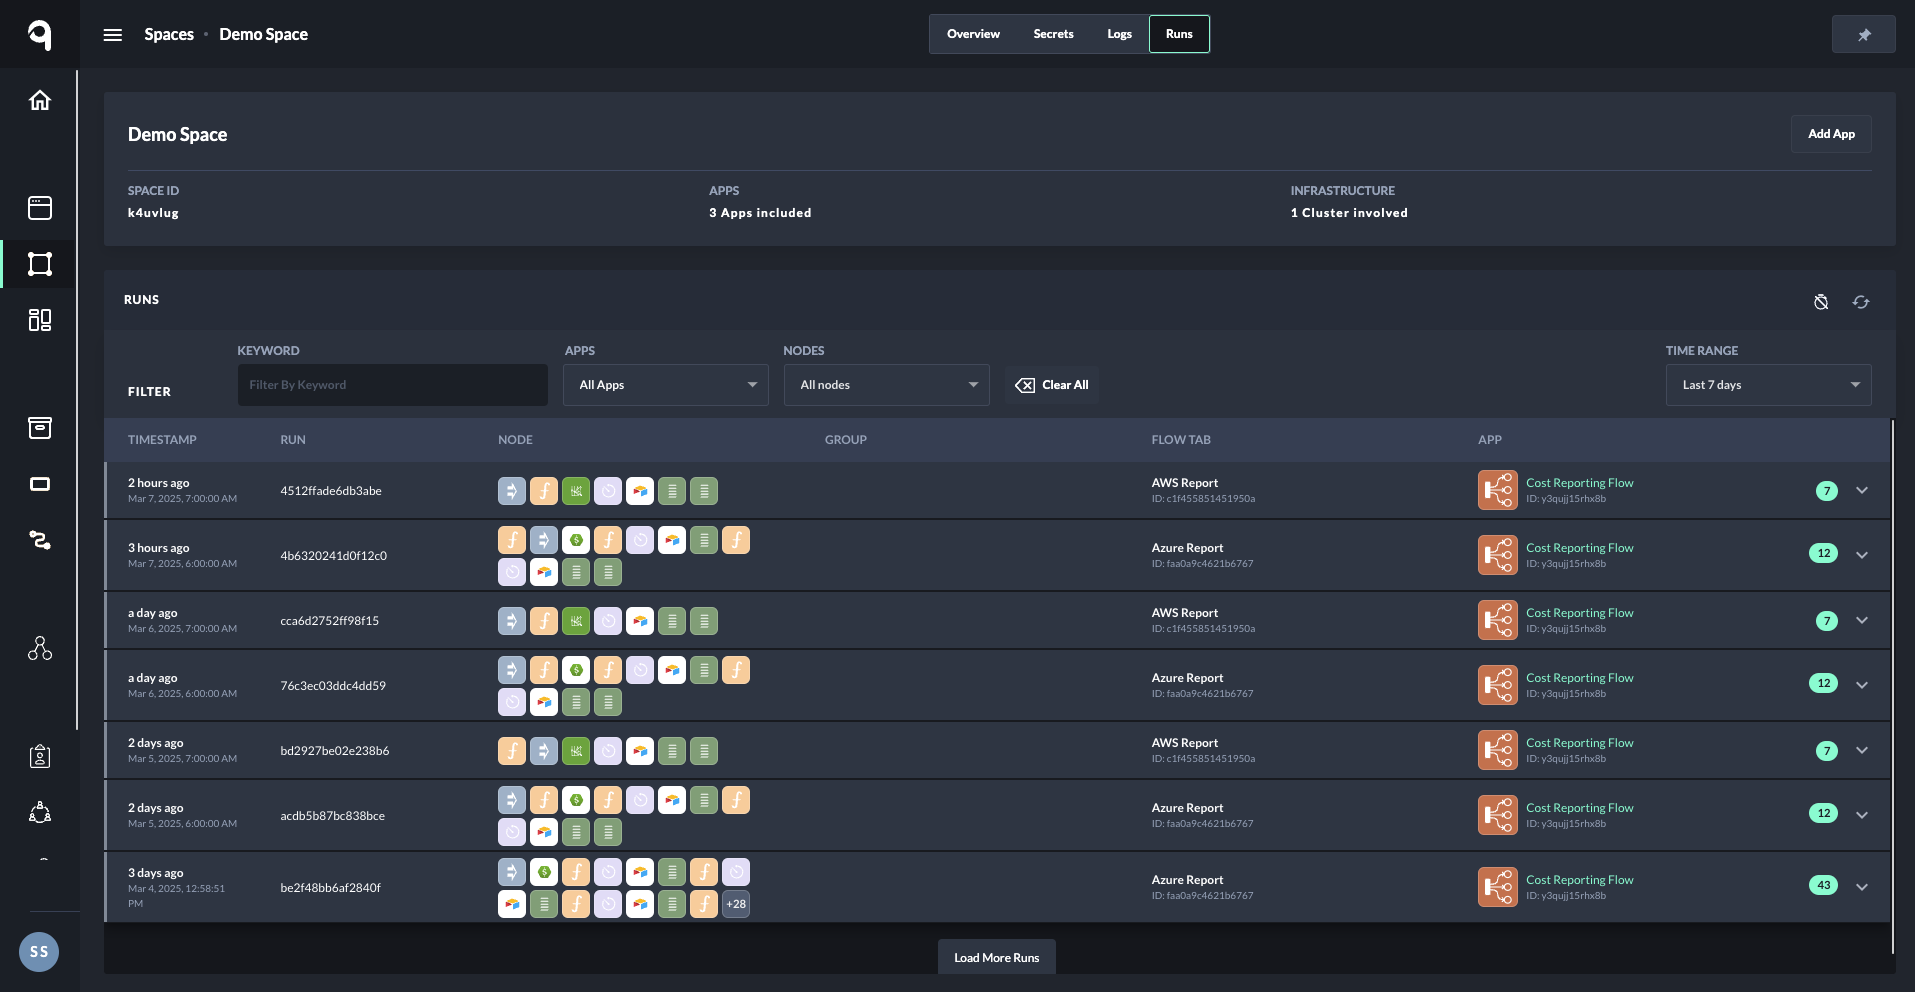
The Run History feature provides a comprehensive overview of all flow runs at the space level, offering detailed records along with filtering and search capabilities. This tool allows you to monitor every step of any flow without requiring additional configuration.
You can access the Run History by navigating to:
-
Spaces → Select a specific space → Runs tab.
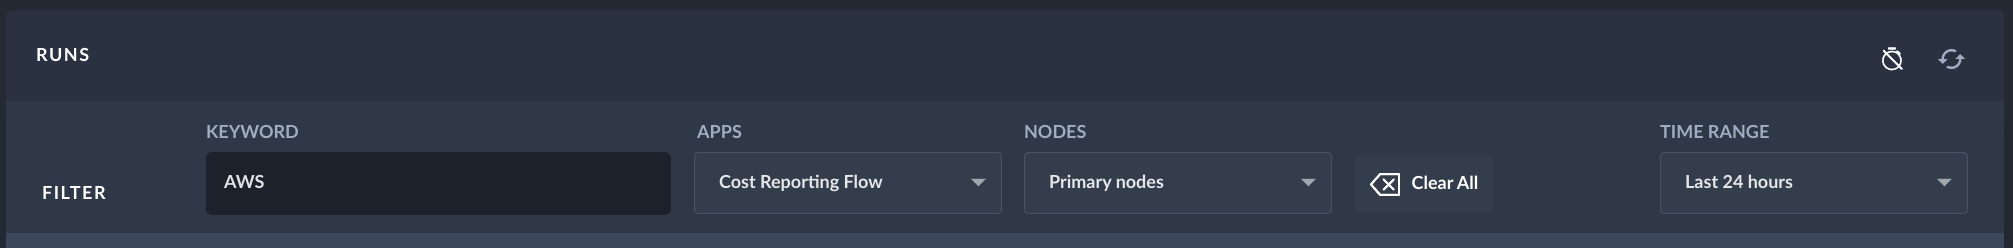
Filters and Search Options
The Run History provides several filters to help you refine the list of displayed runs:
-
Filter by Keyword: Filter runs based on specific terms.
-
Filter by App: Filter runs by one or more apps within the selected space.
-
Filter by Node Type:
-
All Nodes (default): Displays all nodes involved in each run, providing detailed visibility for debugging.
-
Primary Nodes: Displays only the most important nodes (including all qibb nodes and key standard nodes), focusing on the overall process and hiding lower-level technical details.
-
-
Time Range: Filter runs within a specific time range, such as Last 24 hours.
Optimizing Your Search
Using filters such as App and Time Range can significantly improve search performance by reducing the dataset, resulting in faster results.
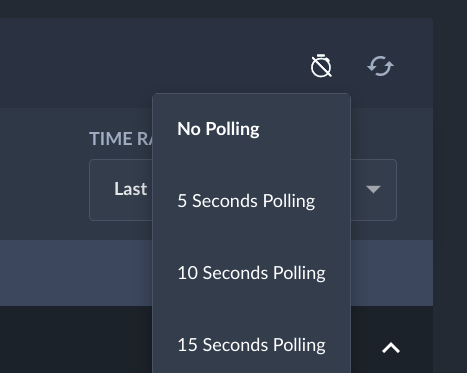
Additional Options
-
Polling Interval: Set an automatic refresh interval (in seconds) to update the Runs table and fetch the latest records. By default, polling is set to No polling.
-
Refresh Button: Manually refresh the Runs table to display the latest data.
Run History Table Columns
The Run History table includes the following columns:
|
Column |
Description |
|---|---|
|
Timestamp |
Date and time of the run |
|
Run |
Unique identifier (Run ID) |
|
Node |
Node involved after flow execution |
|
Group |
Node group (if applicable) |
|
Flow Tab |
Flow tab ID and name |
|
App |
App ID and name associated with the flow |
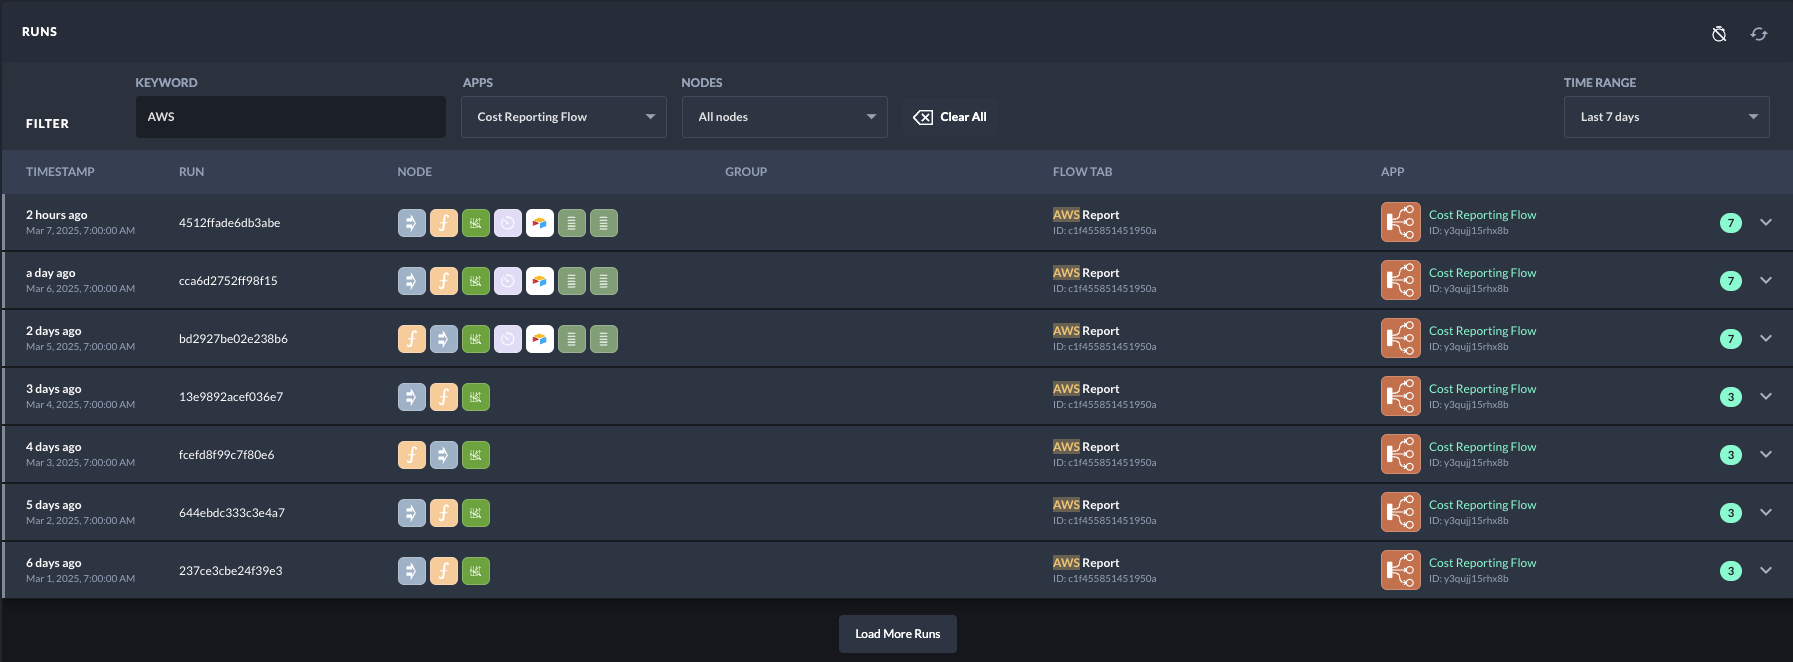
Example: Filtering Runs
Below is an example of the Run History table filtered by a specific keyword and app.
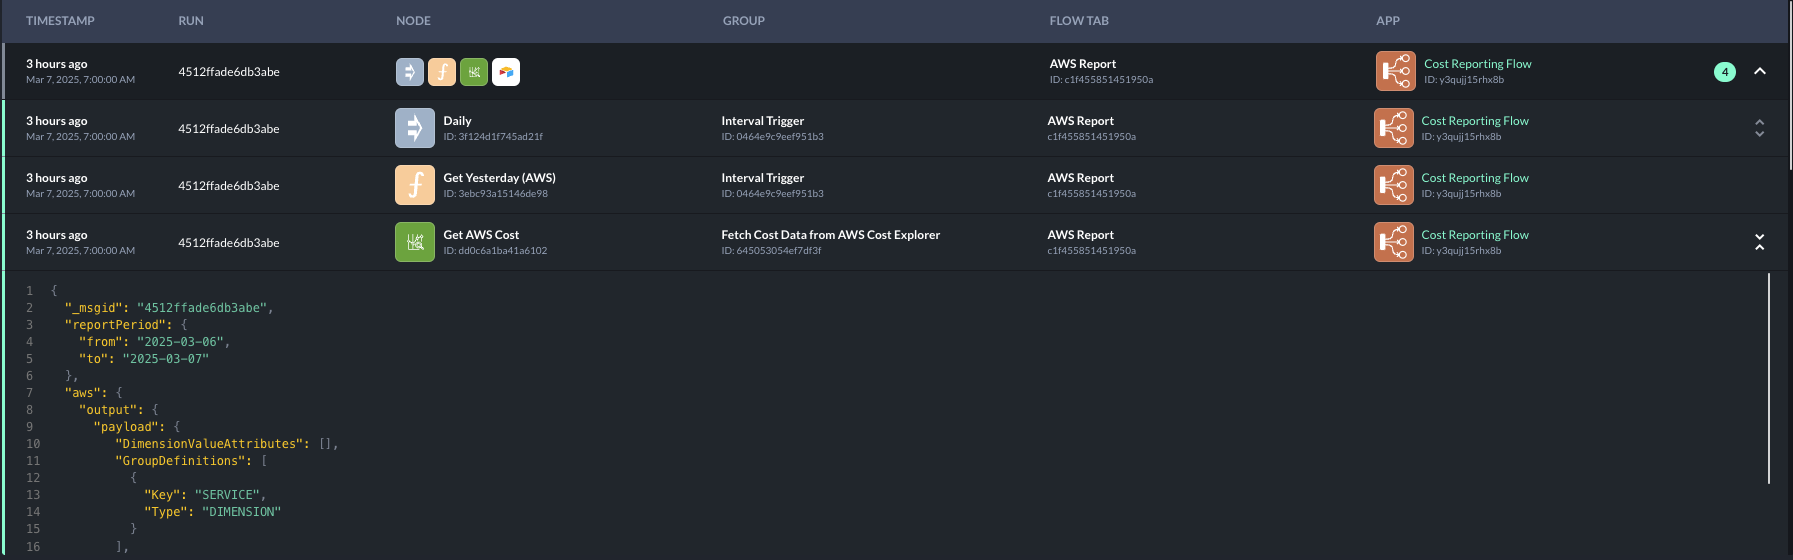
Expandable Run Entries
After a flow executes, its associated nodes are displayed in ascending order within an expandable row in the table.
If all nodes do not fit within the row, a button will indicate how many nodes are hidden. You can view all nodes by clicking the arrow icon on the right side of the row.
-
Viewing Message Content: If a node generates a message object (JSON data processed during a run), an arrow icon appears, allowing you to view the message content directly.