Standard Premium ULTIMATE
The Runtime Monitor provides a real-time overview of your app's operational health directly within the Flow Editor. It enables developers and operators to monitor resource utilization and performance metrics, allowing for proactive adjustments to ensure stability under load.
Key Metrics
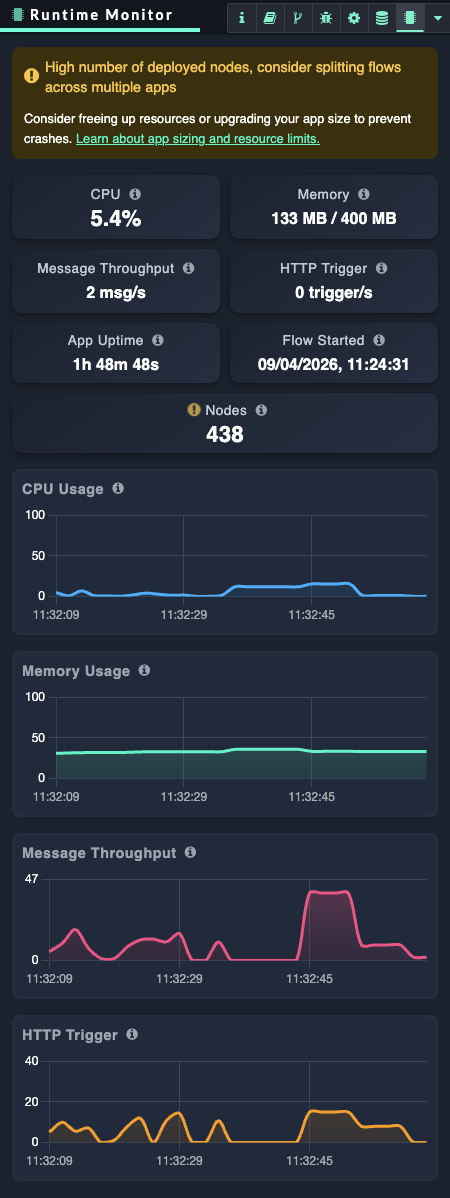
The Runtime Monitor tracks live performance indicators to provide insights into your app's runtime behavior:
-
CPU: Real-time processor consumption.
-
Memory: Memory used by the workflow runtime compared to total available memory, which is a subset of the app’s memory.
-
Message throughput: The number of messages processed per second across all flows.
-
HTTP Trigger: The rate of incoming HTTP requests handled by
http-innodes per second. -
App uptime: Duration the app has been active, resetting on app deployment, upgrade, or restart.
-
Flow Started timestamp: The exact time the current flow started, resetting with any action that restarts the flow.
-
Node count: Total number of nodes deployed within the flow.
Accessing the Runtime Monitor
You can access the feature directly via the Flow Editor interface:
-
Locate the right-hand sidebar.
-
Select the Runtime Monitor tab.
Alerts and Thresholds
The Runtime Monitor proactively alerts you when your app resources exceed defined limits, allowing you to address potential bottlenecks before they impact service, including:
|
Metric |
Warning Threshold |
Critical Threshold |
Guidance |
|---|---|---|---|
|
CPU Usage |
50% High average CPU usage |
75% Critical average CPU usage, flow performance may degrade |
Optimize flow logic, reduce unnecessary processing, and consider scaling the app or splitting workloads across instances |
|
Memory Usage |
80% Memory usage elevated |
90% Memory usage critically high, risk of app instability or crash |
Review memory-heavy nodes and loops, reduce payload sizes, reduce context sizes, and split flows or scale the application |
|
Message Throughput |
200 msgs/second Message throughput rate elevated |
500 msgs/second Message throughput rate reaching critical peaks, flow performance may degrade |
Throttle incoming messages, introduce queuing (See Add job management capabilities to your flow with checkpoints), or distribute load across multiple flows/apps. |
|
HTTP Requests |
50 req/second HTTP Trigger rate elevated |
100 req/second HTTP Trigger rate reaching critical peaks, flow performance may degrade |
Implement rate limiting, caching, or load balancing to reduce request pressure |
|
Deployed Nodes |
350 High number of deployed nodes, consider splitting flows across multiple apps
|
500 Critical number of deployed nodes, may exceed app resource limits |
Split flows into multiple apps, remove unused nodes, and modularize architecture |
When a threshold is exceeded, a notification appears directly in the Flow Editor. To maintain a clean workspace, the system limits the frequency of alerts by waiting a set interval before triggering subsequent notifications.
Each alert includes:
-
Status Indicator: Clearly labels the state as Warning (elevated usage) or Critical (severe risk).
-
Contextual Hints: Guidance on the specific threshold breach.
-
Direct Navigation: A link to open the Runtime Monitor sidebar for immediate inspection.
Flow & Resource optimization
If your app consistently approaches resource limits and warning or critical thresholds, consider freeing resources or upgrading your app size to prevent crashes.
-
Review your flow design to address bottlenecks, including logic in your function code, flow logic such as loops and split/joins, and data payload sizes in msg objects and context.
-
Uninstall unused nodes to free resources.
-
Consider splitting your flow across multiple apps.
-
Consider adding checkpoints to queue peak workloads. Learn more: Add job management capabilities to your flow with checkpoints
-
You may optimize performance by selecting a more suitable app size if available. Learn more:Picking the right size for your flow app