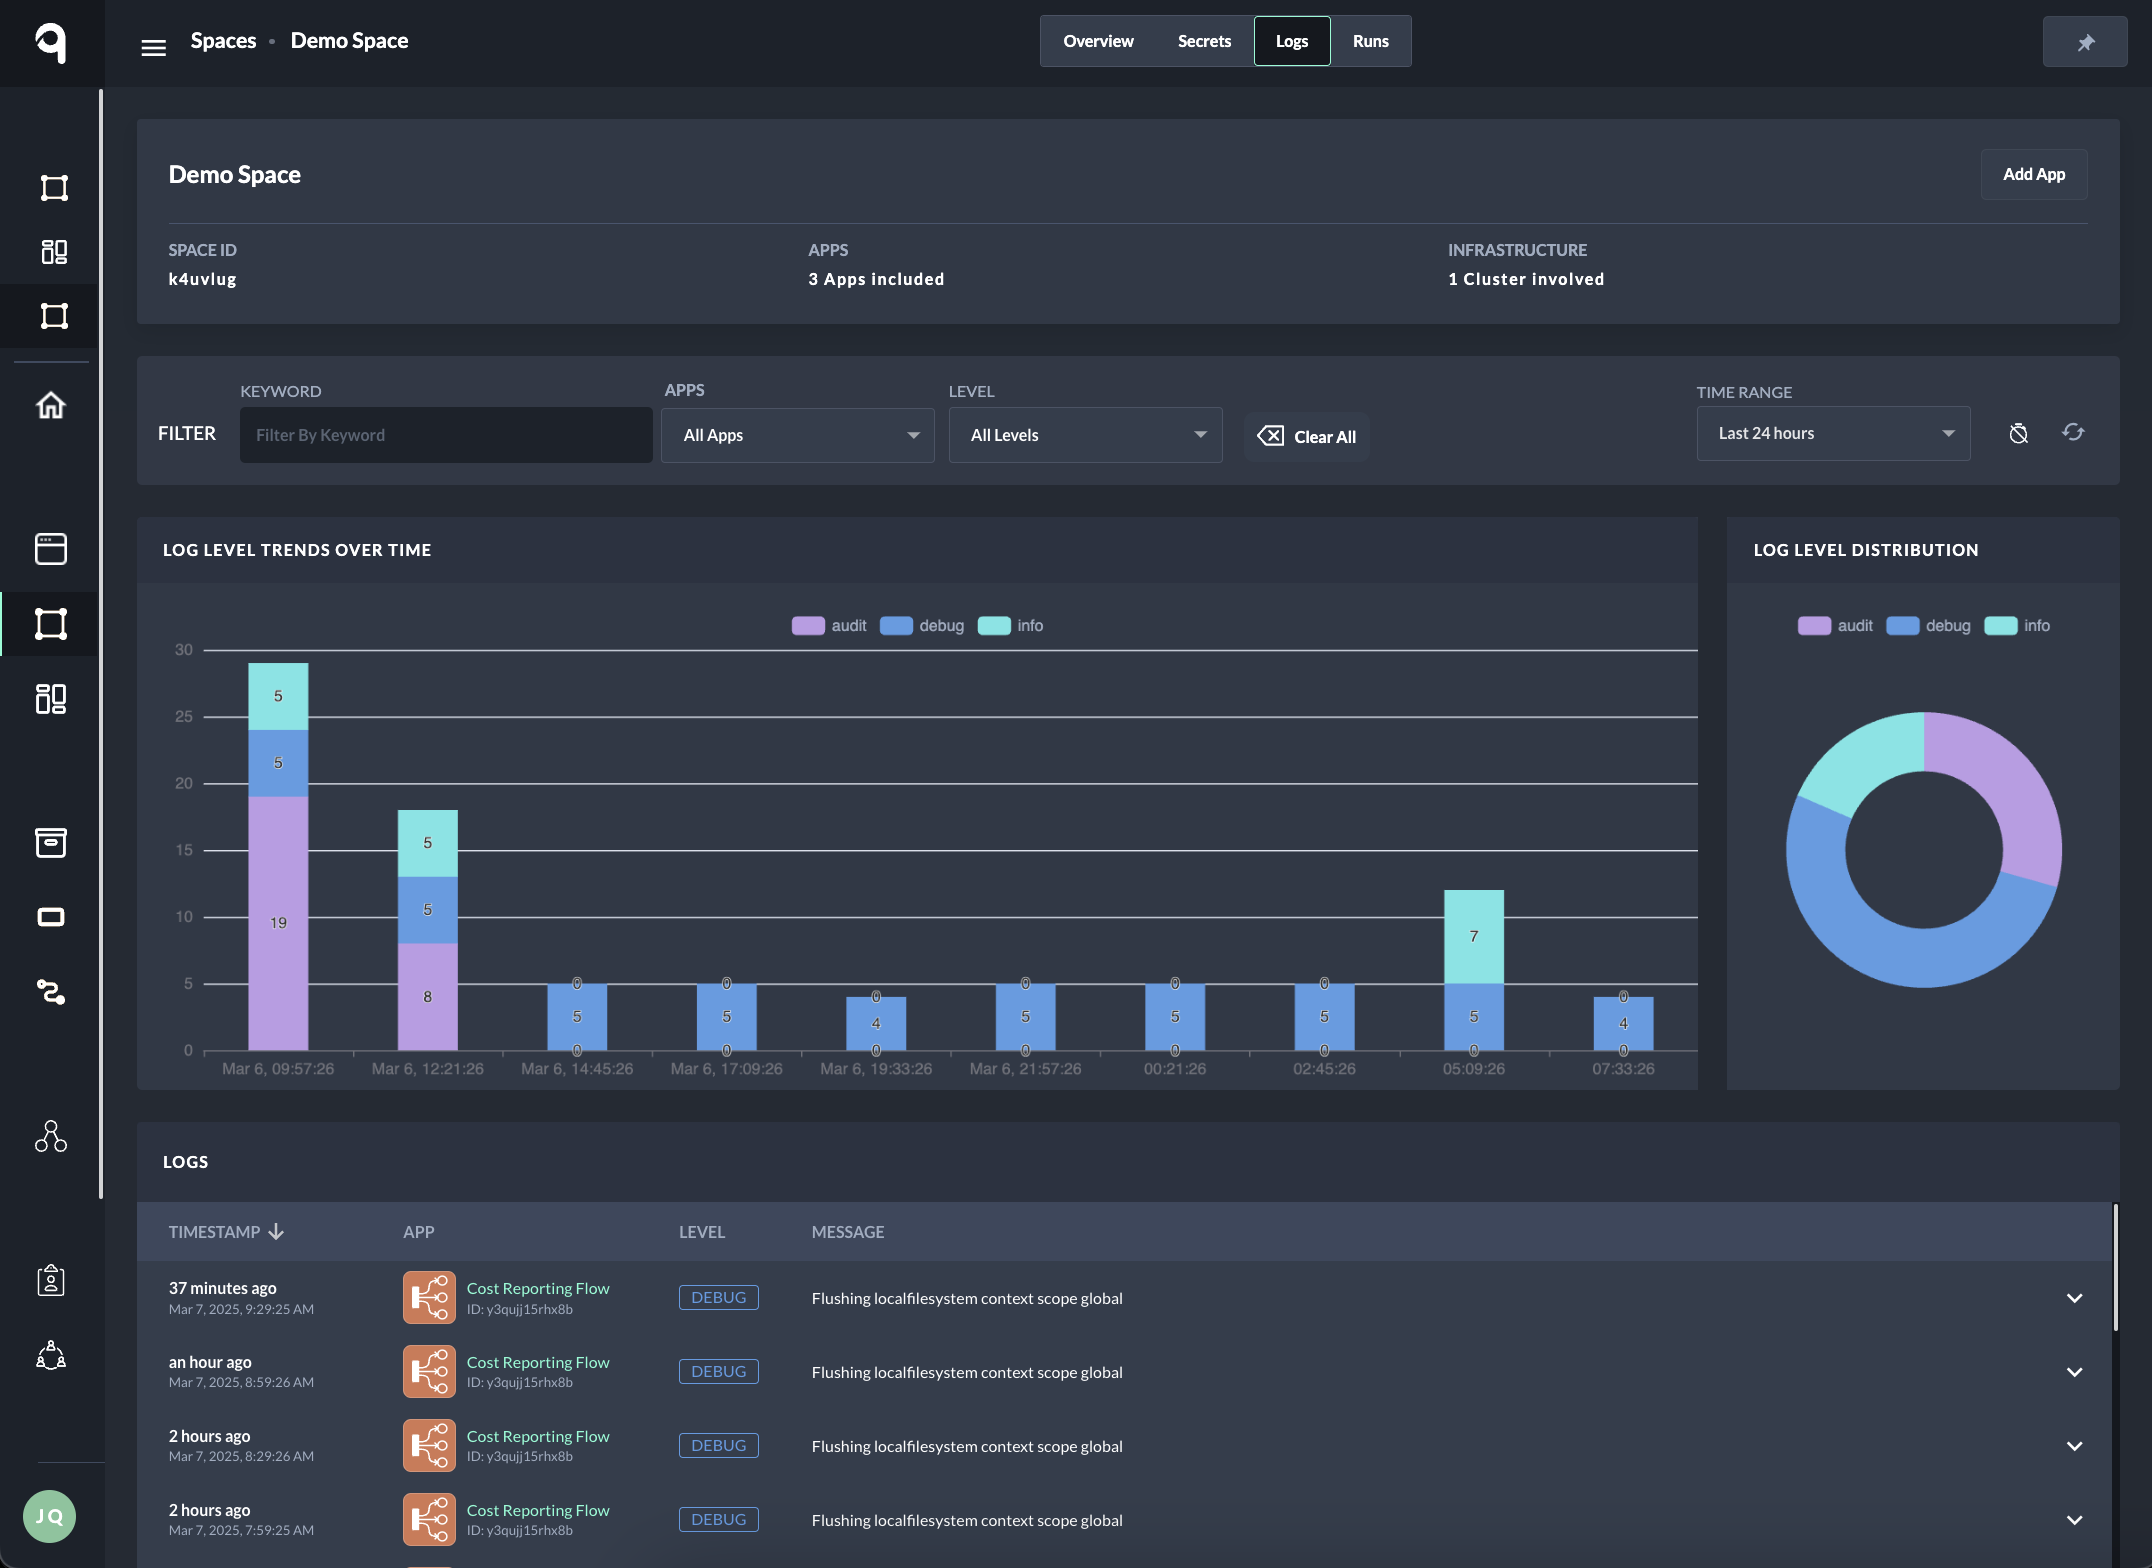
The Log Browser is a powerful tool designed to make debugging and troubleshooting more efficient and intuitive at the space level. It offers detailed insights and greater control over your apps and workflows.
With support for full-text search and advanced filters, the Log Browser helps you quickly identify and resolve issues, saving valuable time and minimizing downtime.
Tip: How to log from your flow
Logging is an essential practice when developing a flow, as it provides you with insights into the flow's operation and helps identify issues early.
→ Learn how to log from your flows here.
Accessing the Log Browser
To access the Log Browser:
-
Navigate to Spaces.
-
Select a specific space.
-
Click on the Logs tab.
Filters and Search Options
The Log Browser provides several filters to help narrow down the displayed log entries:
-
Filter by Keyword: Search for specific terms within log entries.
-
Filter by App: Filter logs by one or more apps within the selected space.
-
Filter by Level: Filter by specific log levels, such as:
-
trace -
debug -
info -
warn -
error -
fatal -
audit -
metric
-
-
Time Range: Filter logs within a specified time frame, such as Last 30 minutes.
Optimizing Your Search
Using filters like App and adjusting the Time Range can enhance search performance by reducing the dataset, resulting in faster search results.

Additional Options
-
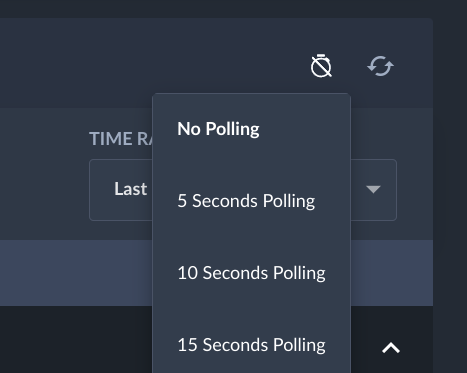
Polling Interval: Set an automatic refresh interval (in seconds) to update the logs table with the latest entries. The default is No polling.
-
Refresh Button: Manually refresh the logs table to retrieve and display the most recent log entries.
Log Level Trends Over Time
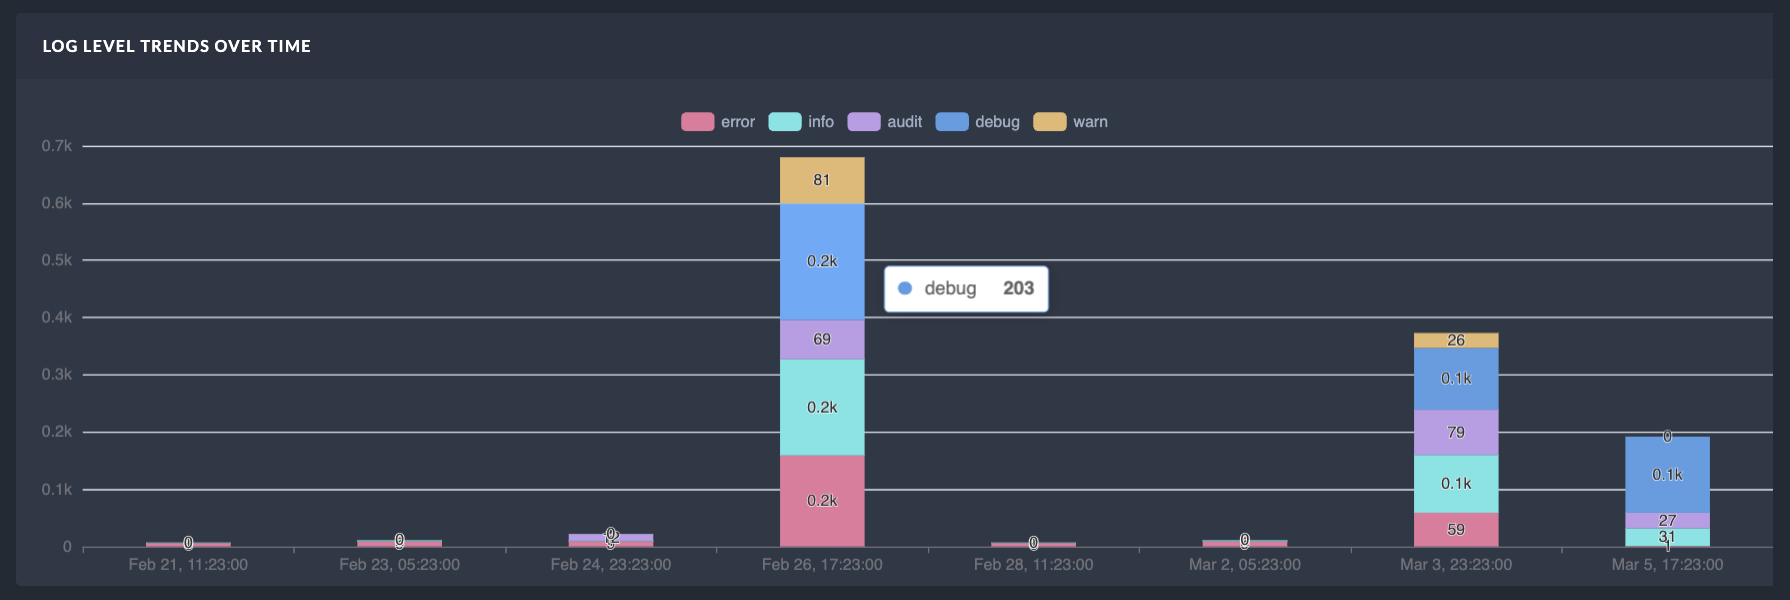
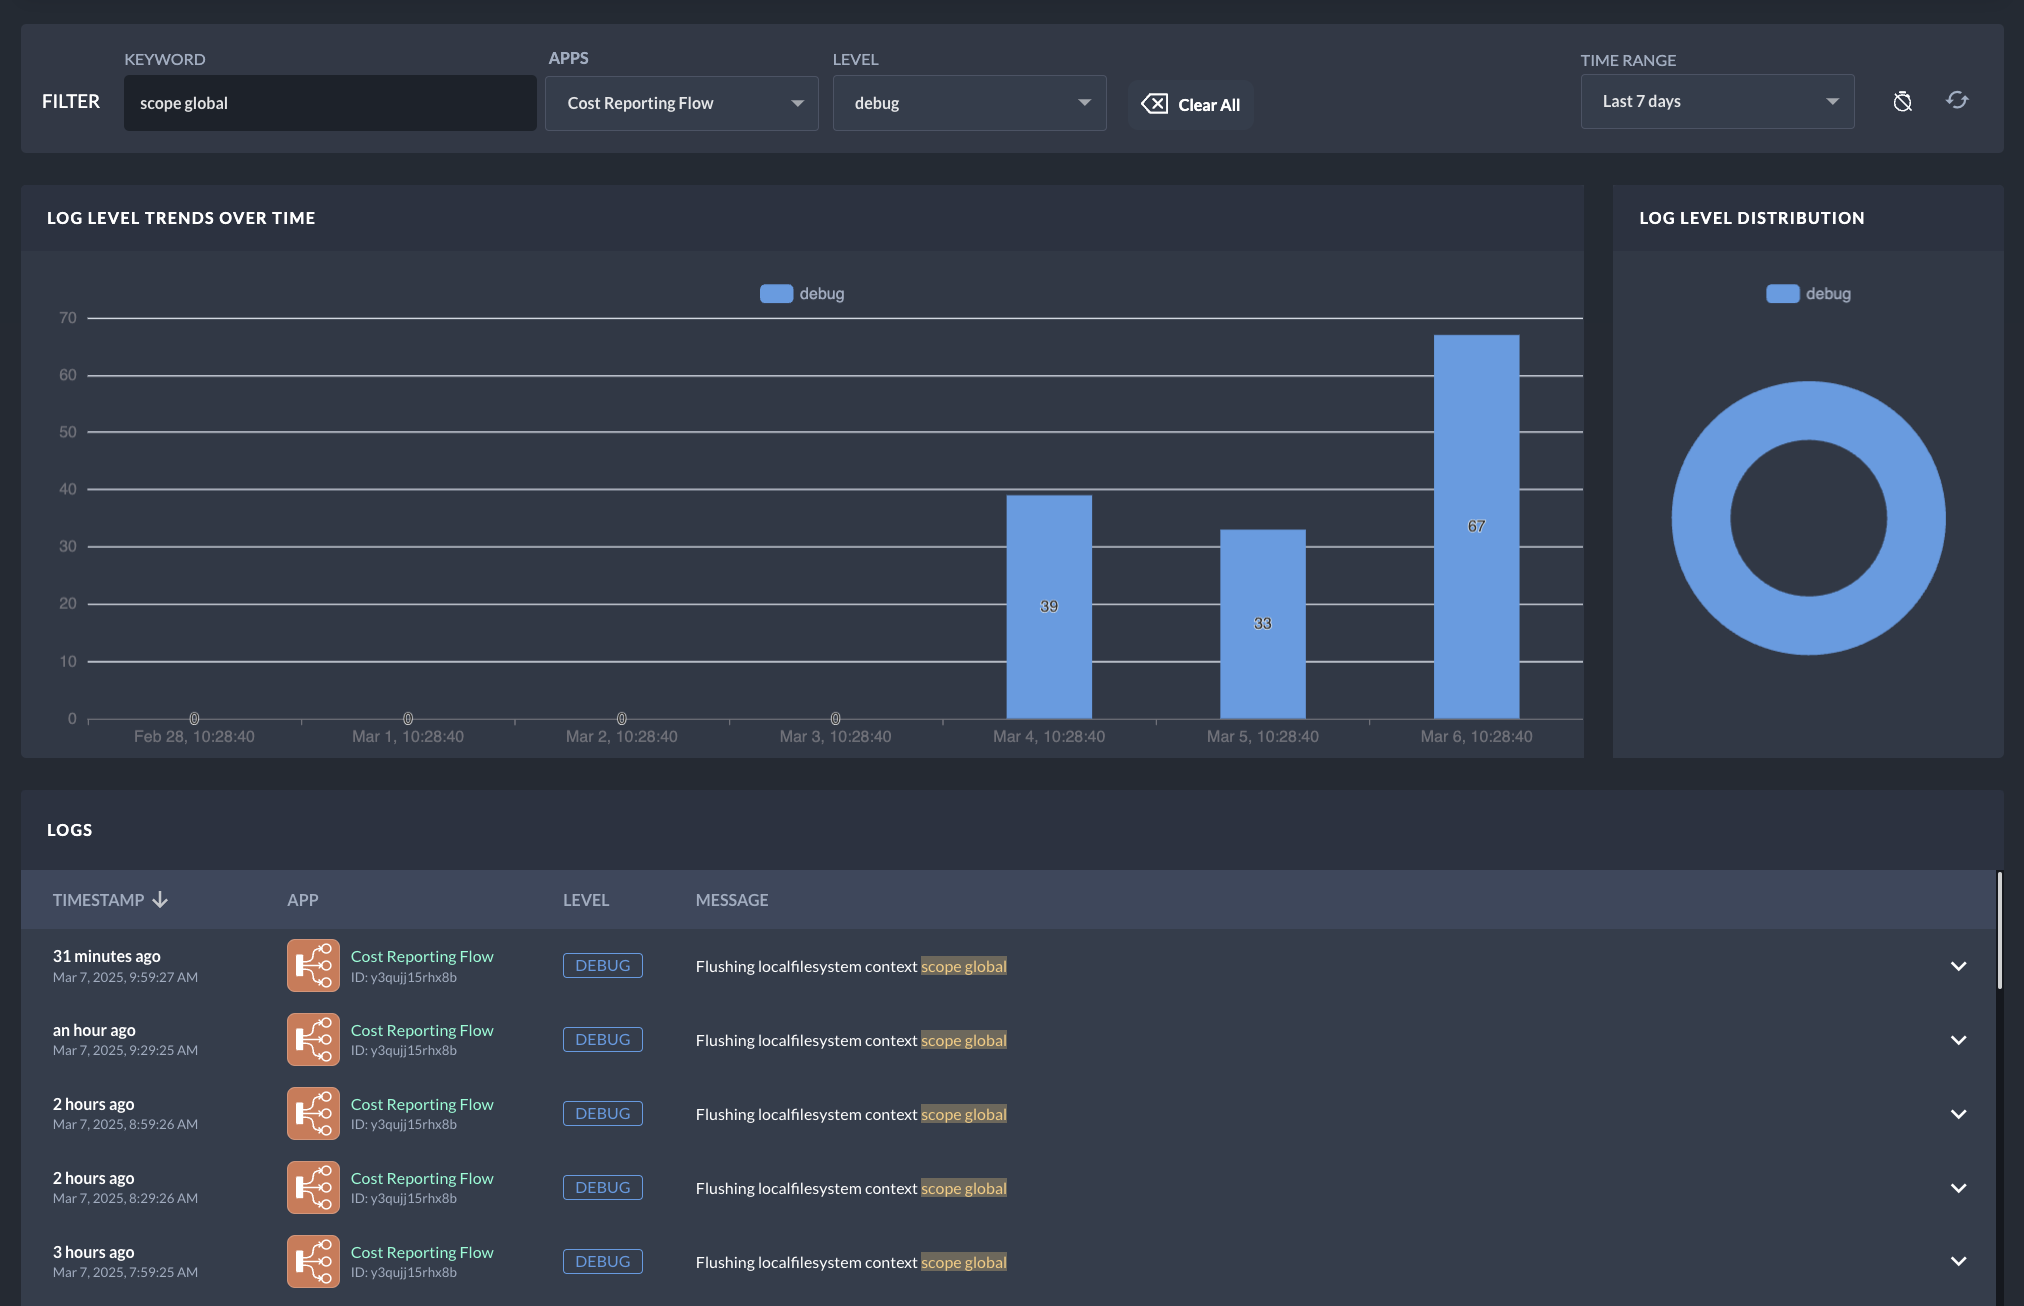
This bar chart displays the number of log entries per level (info, error, etc.), grouped by time intervals within the selected time range filter.
Log Level Distribution
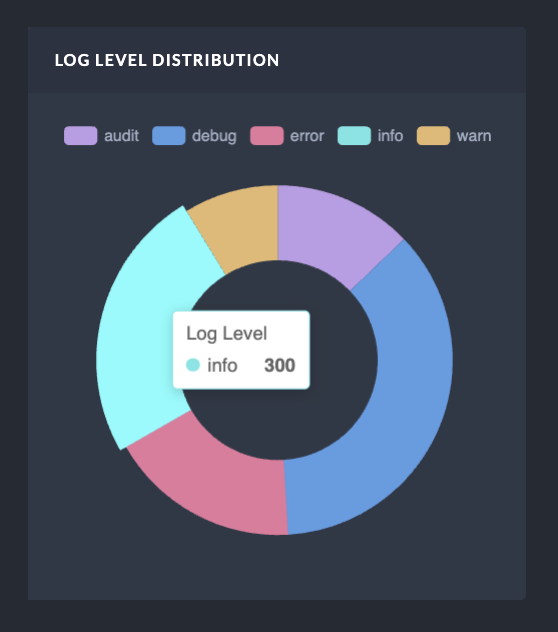
This pie chart shows the overall distribution of log entries across all levels.
-
Level Visibility Control: Toggle the visibility of specific log levels by clicking the level labels at the top of either chart. This helps focus on rare log levels that may be hard to spot at first glance.
-
Hover for Details: Hover over any chart slice (in the pie chart) or bar (in the trend chart) to view the total number of occurrences for that level.
Applying Filters
Both charts automatically update whenever you apply new filters, giving you an up-to-date visual overview of your logs.
Log Browser Table Columns
The Log Browser table includes the following columns:
|
Column |
Description |
|---|---|
|
Timestamp |
Date and time of the log entry (sortable) |
|
App |
App ID and name associated with the log entry |
|
Level |
Log severity level |
|
Message |
Main log message body (or the full log content if no specific message is available) |
Example: Filtering Logs
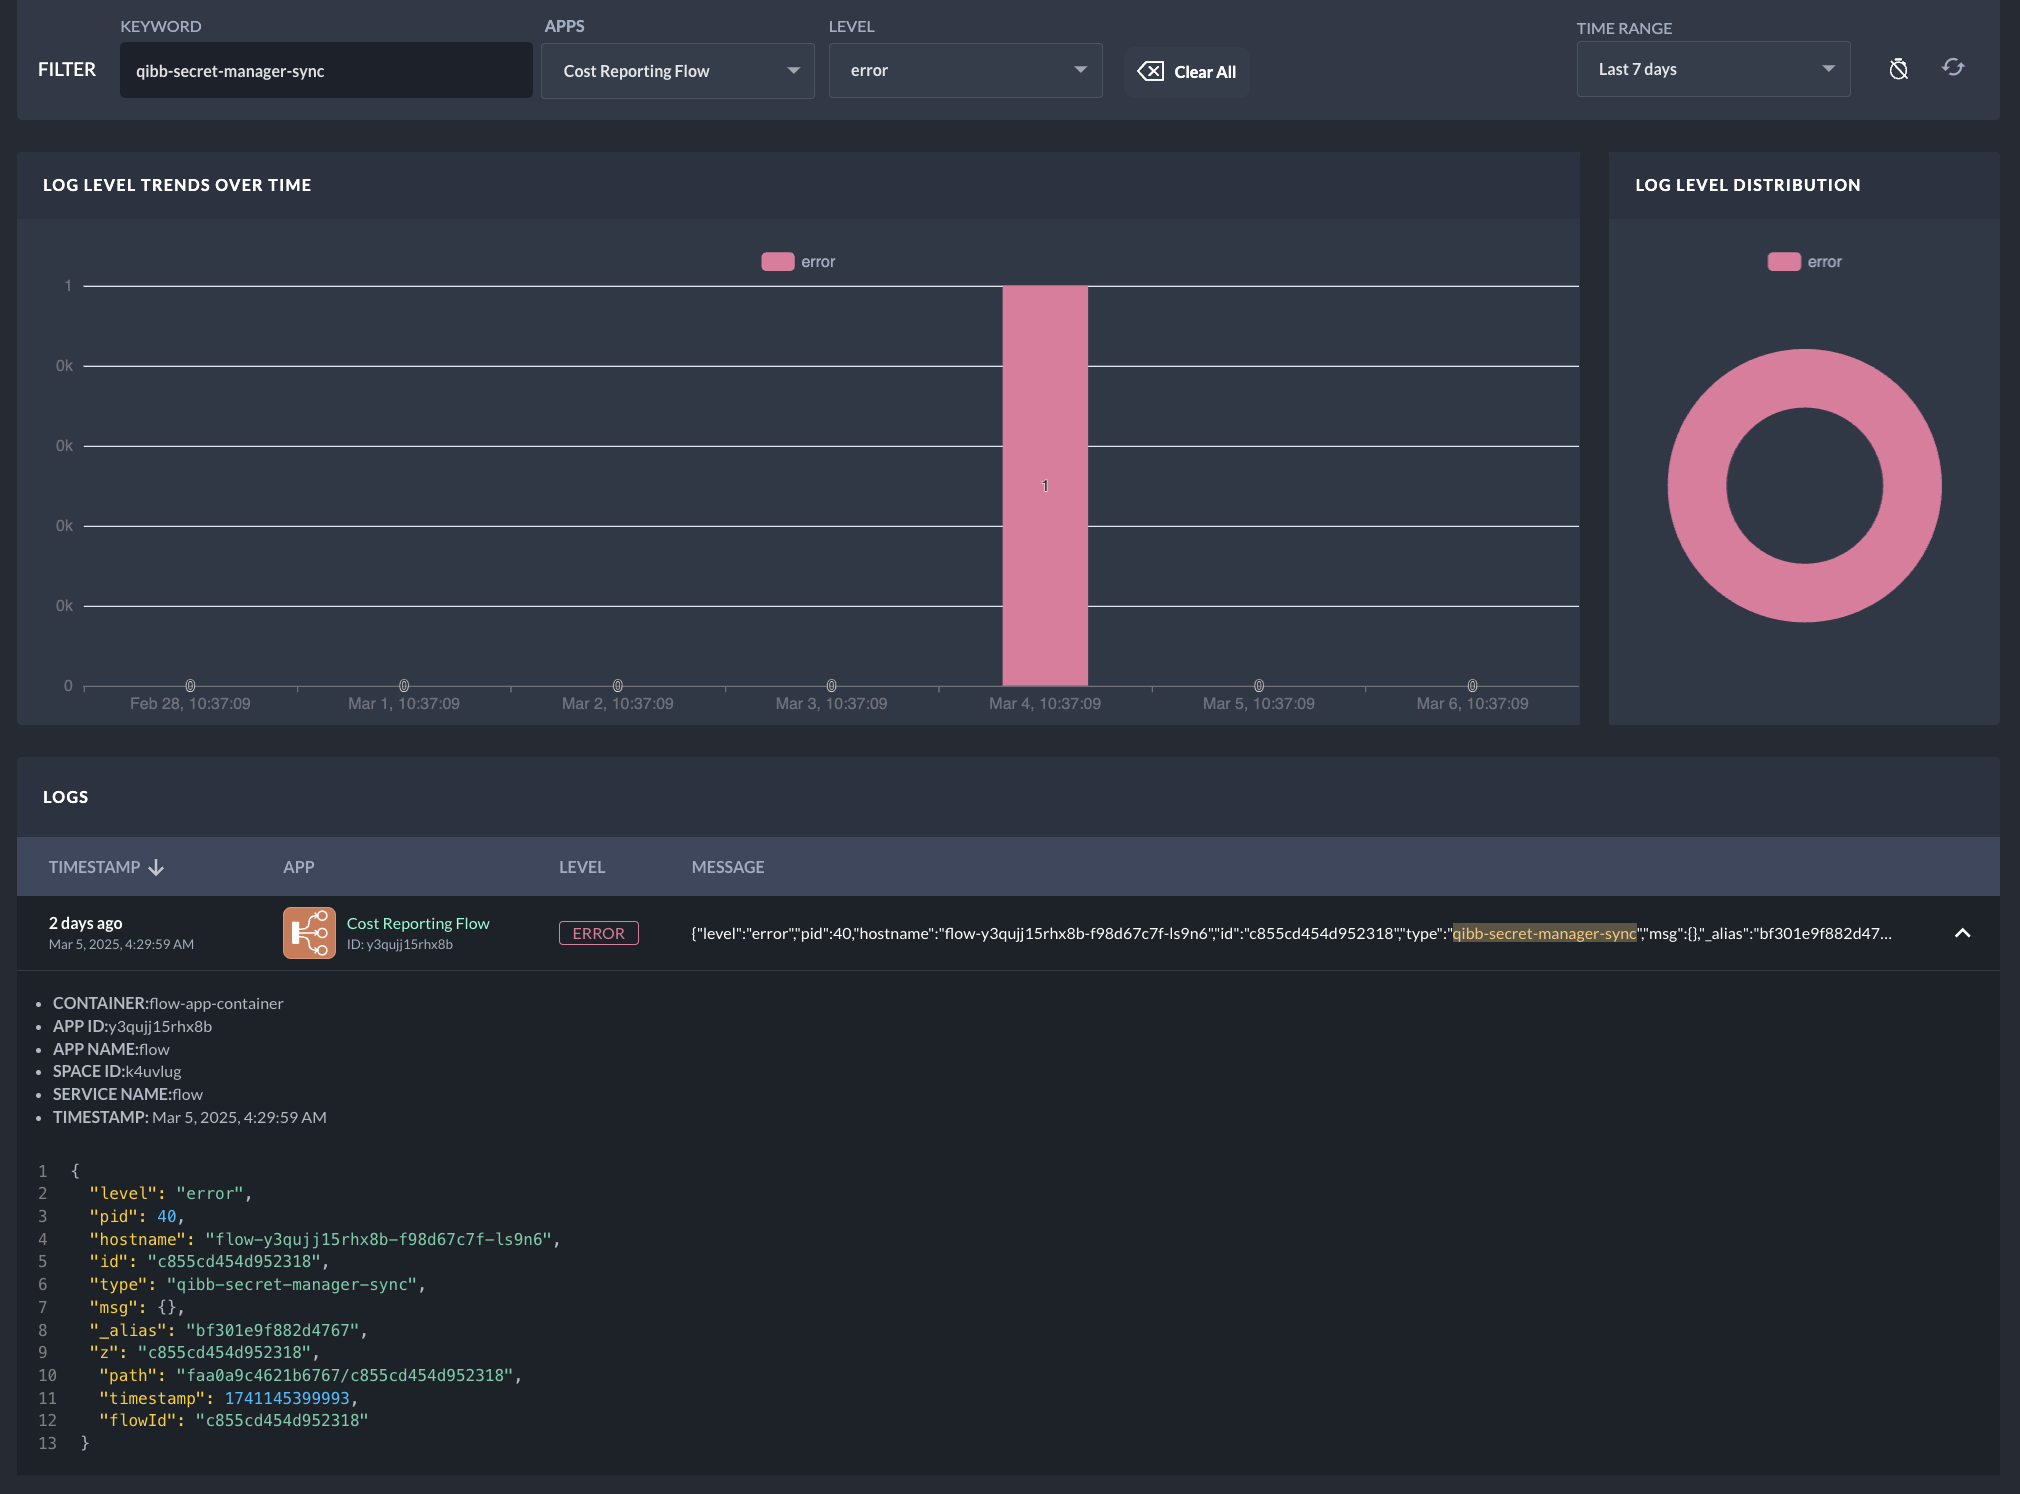
Here’s an example of the Log Browser table after applying filters for a specific keyword, app, and log level.
Expandable Log Entries
Each log entry is displayed as a row, with the option to expand it for more details.
Viewing Context Information
Expanding a log entry reveals additional context details, including:
-
Container
-
App ID
-
App Name
-
Space ID
-
Service Name
-
Timestamp
Viewing Log Data
The expanded view also displays the actual log data in JSON format, providing all available information for deeper troubleshooting.