ULTIMATE
Feature Preview: This feature is available for Ultimate subscribers as a subscription add-on and may incur additional charges.
The Datadog Observability Integration streams logs and metrics from all apps into your Datadog account for seamless observability.
Offered as an add-on feature, this backend integration enables monitoring from external systems, faster troubleshooting, and unified visibility across your application ecosystem.
Key Capabilities
1. Platform-Level Integration
-
Available as an optional add-on at the platform level
-
Automatically captures and streams monitoring data of all deployed apps
2. Application Log Streaming
-
Streams application logs in near real-time to Datadog
-
Includes records generated at the application layer for debugging and troubleshooting, including:
-
Log output of apps ranging from various levels, including errors, warnings, info and audit logs (optional).
-
Run output of apps that represent the execution sequence of a flow (optional).
-
Job events of apps generated by checkpoints of a flow (optional).
-
-
Enables:
-
Centralized log aggregation
-
Advanced search, filtering, and analytics
-
Faster root cause analysis
-
→ Datadog log management allows teams to collect, process, and analyze large volumes of log data efficiently.
3. Application Metrics Streaming
-
Streams key runtime performance metrics, including:
-
CPU utilization of app
-
Memory usage of app
-
-
Provides continuous visibility into system health and performance
→ Metrics in Datadog are time-series data points used to monitor system health and performance over time
How It Works
-
Apps generate logs and metrics
-
qibb Platform automatically collects telemetry data
-
Data is streamed to Datadog ingestion endpoints
-
Datadog processes and visualizes the data in dashboards
This integration provides telemetry streaming and example dashboards for Datadog.
Creation and management of dashboards, monitors, alerts, retention policies, and Datadog resources remain the responsibility of the customer.
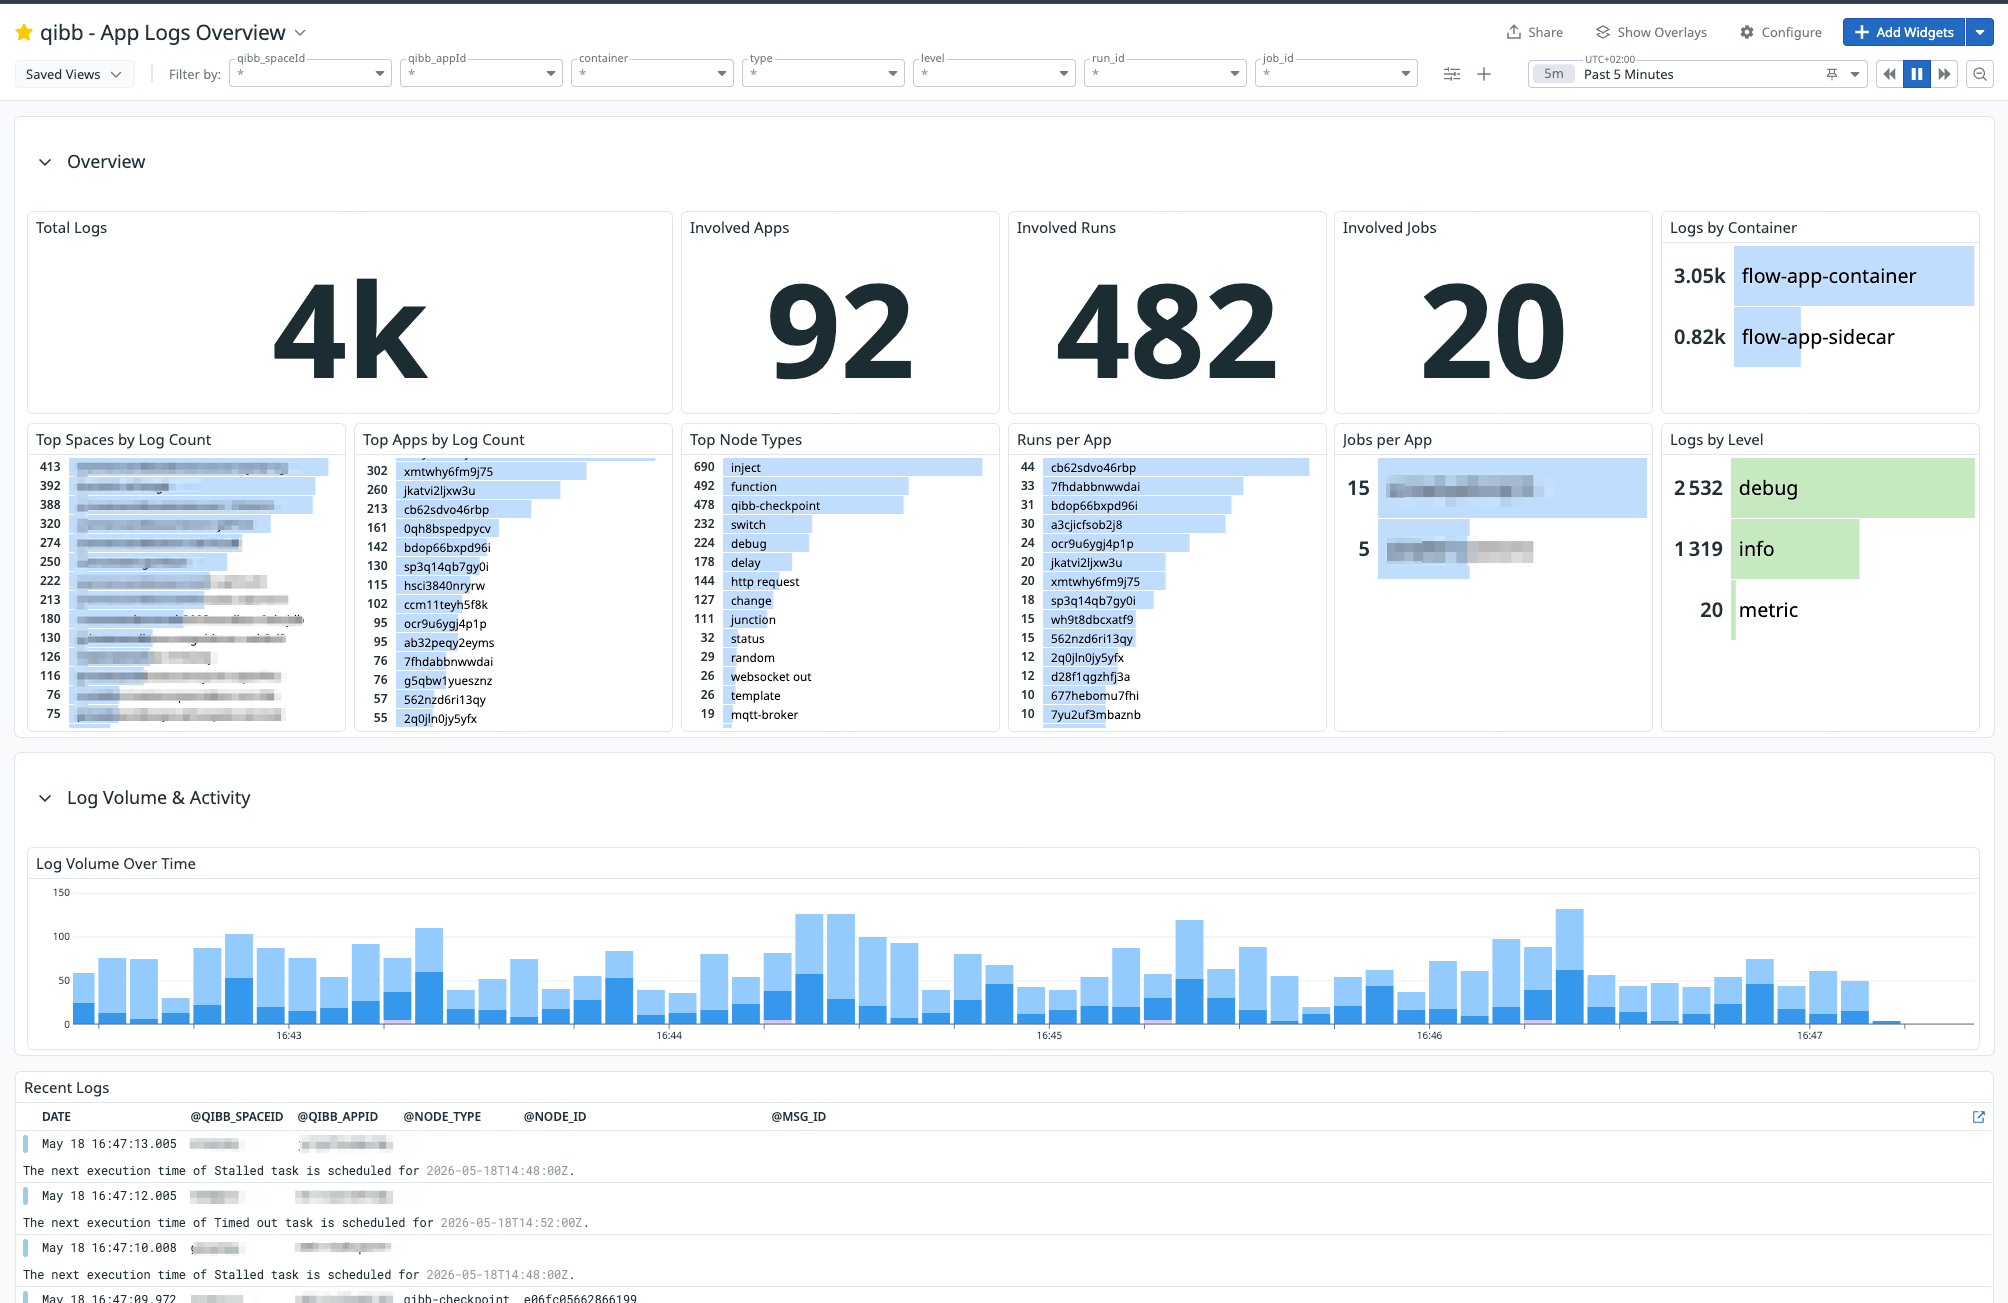
Datadog Dashboard
The following example dashboard is available for import into Datadog. It provides an overview of app logs for the selected time range. It summarizes total log volume, involved apps, runs, and jobs, and breaks logs down by space, app, container, node, and log level. It also includes a log volume timeline and a recent logs table to help users quickly spot activity spikes and inspect the latest log messages.
Log Data Fields
Below are the most common data fields included in the records. Most fields are optional. Data fields may vary by app or platform version.
|
Category |
Field |
Description |
Example |
|---|---|---|---|
|
Time |
timestamp |
Timestamp of the record. |
|
|
@timestamp |
Formatted timestamp |
|
|
|
Log type |
type |
If empty: Log record. If “ If “ |
- |
|
Log Information |
level |
Log level, e.g. |
|
|
stream |
Log output stream, e.g. |
|
|
|
message |
The log message |
|
|
|
App Information |
qibb_appId |
Id of the app. |
|
|
container |
The component of the app. Either |
|
|
|
qibb_spaceId |
Id of the space which contains this app. |
|
|
|
Flow Information |
flow_id |
Id of the flow tab. |
|
|
Node Information |
node_id |
If of the node. |
|
|
node_type |
Node type |
|
|
|
node_name |
Node name |
|
|
|
Flow Message Information (msg) |
msg_id |
Id of the processed msg object. |
|
|
Run Information |
run_id |
Id of the run. |
|
|
Job Information |
job_id
|
If of the job. |
|
|
|
msg |
Only applicable if type=job_event. A JSON containing event metadata. Typically includes:
|
|
|
Infrastructure |
qibb_cluster_id |
Id of the cluster which is hosting this app. |
|
Metrics
The following metrics is the standard set which can be provided to monitor apps.
Metric names may change in future releases. Exact names vary by app and platform version.
|
Category |
Metric |
Availability |
Description |
|---|---|---|---|
|
Resource usage |
|
Default |
Total CPU time consumed by the app container. Can be used to monitor CPU utilization over time. |
|
Resource usage |
|
Default |
Current memory working set of the app container. Can be used to monitor memory consumption and detect memory pressure. |
|
Resource limits |
|
Optional |
Configured CPU limit of the app container. Helps compare CPU usage against the configured app limit. |
|
Resource limits |
|
Optional |
Configured memory limit of the app container. Helps compare memory usage against the configured app limit. |
|
Lifecycle |
|
Optional |
Number of app container restarts. Indicates unstable apps, crash loops, or repeated failures. Note: Users may also restart containers during administrative actions like app restarts or upgrades. |
|
API / Network usage |
|
Default |
Total number of completed requests routed to the app through the qibb API gateway. |
|
API / Network usage |
|
Default |
Number of successful responses returned by the app. |
|
API / Network usage |
|
Default |
Number of client error responses, for example invalid requests, unauthorized requests, or missing resources. |
|
API / Network usage |
|
Default |
Number of server error responses, typically indicating application or upstream failures. |
|
API / Network usage |
|
Optional |
Number of redirect responses returned by the app. |
|
API / Network usage |
|
Optional |
Request processing duration for requests routed to the app. Can be used to monitor latency percentiles where available. |
-
Metrics are available through a curated allowlist managed by qibb’s DevSecOps team for SaaS deployments. Additional metrics can be exposed on request for PaaS deployments, depending on availability.
-
Tags provide customer-safe attribution and enable filtering or aggregation by app, space, and cluster level, as well as breakdown of the app components (pod or container).
-
Optional metrics may increase Datadog custom metric usage depending on the number of emitted tag value combinations.
Datadog Usage Estimate
Datadog usage varies primary by the number of qibb apps, and by executed runs and jobs. The data below should give an estimate of a typical environment:
-
1Infrastructure Host per qibb cluster (representing the data service that collects and pushes the data to Datadog) -
10-35+Custom Metrics per qibb app (depending on the enabled metrics, emitted tags, and Datadog configuration) -
1M+Indexed Logs per 100 qibb apps per day.
Note that all Datadog costs are billed directly by Datadog and are the customer's responsibility.